We work with everviz to provide interactive data visualizations
We're happy to announce that we have signed an agreement with Norwegian data visualization platform everviz. Our market leading news automation platform and everviz’s powerful data visualisation tools will be combined into a cutting edge automated editorial product with great relevance to local readers.
The partnership comes as our publisher partners on both sides of the Atlantic, among them US local media giant McClatchy and Swedish NTM Media, are proving the value of using newsroom robots to build out their local community information. The automated content packages work as a valuable complement to the journalism produced by reporters in local newsrooms, providing coverage on topics like local sports, real estate sales and company registrations. Through the partnership with everviz, we'll add further value to the automated content we generate.
Everviz's solution will add interactive and responsive charts and graphs for readers, all rendered to be accessible (a11y) for everyone on all devices and screen sizes. This also encompasses those with disabilities such as cognitive, neurological, physical, and visual impairments.
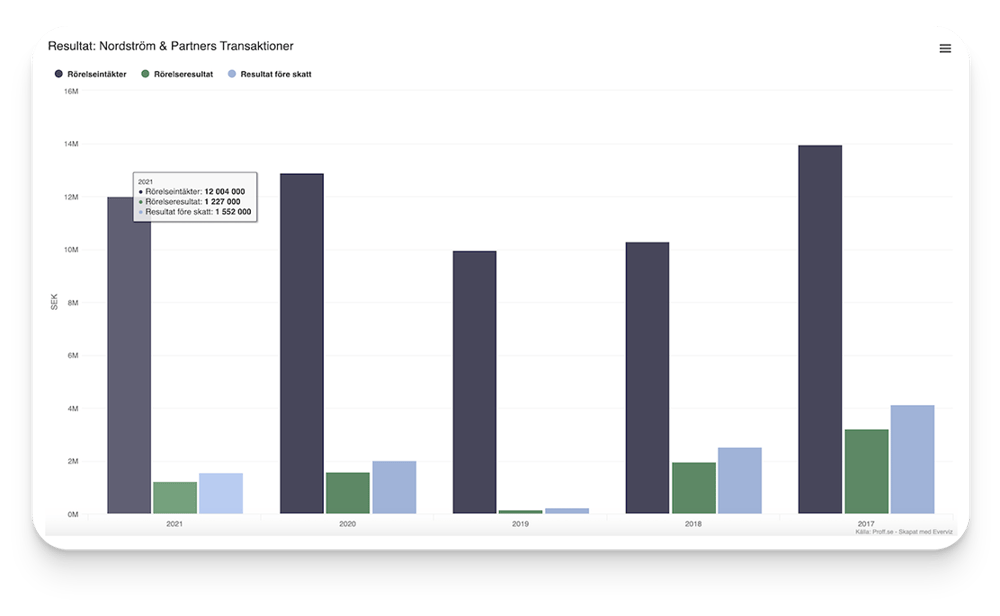
The first publication of texts enhanced with everviz data visualizations are business articles based on data on local businesses’ annual reports, now live on Swedish local media group NTM’s sites. Each text is an easy-to-understand summary of the company's revenue, profit, profit before tax as well as information on the number of employees, CEO salary and dividends. The texts are now accompanied by two interactive graphs. One shows the individual company’s turnover, profit and profit before tax for the past three years (view in interactive mode here). The other one shows the top ten local companies in that industry, listed in order of size of turnover (view here). Says NTM Chief Digital Reader Revenue Officer Jens Pettersson: “The visualizations provide variation to the copy, catch the reader’s attention and provide facts in a clear and visually pleasing way. Together with the [Google] map which shows the physical location of the company, the graphs contribute to the story telling, which is good, as there are never any new photos to go with these automatically generated texts.”
Our Chief Product Officer Henning Johannesson comments on our collaboration with everviz: “Everviz's dynamic graphs lift this content to another level, where local readers get a lot of information in one clear overview. We’re looking forward to further exploring the opportunities offered by including data visualizations in other content products, such as real estate sales, company registrations as well as in sports widgets. There’s no doubt visualizations significantly enhance the value of automated community content.”
Says everviz CEO Håvard Tveit: “We share the same passion for data as United Robots, and we are fascinated by how far United Robots has come with generating high-quality automated content based on data. It is a privilege to come in and enrich the content with visualizations. We're on a mission to give everyone the power to communicate data through engaging visual content, and why not include robots as well?”